
The Problem
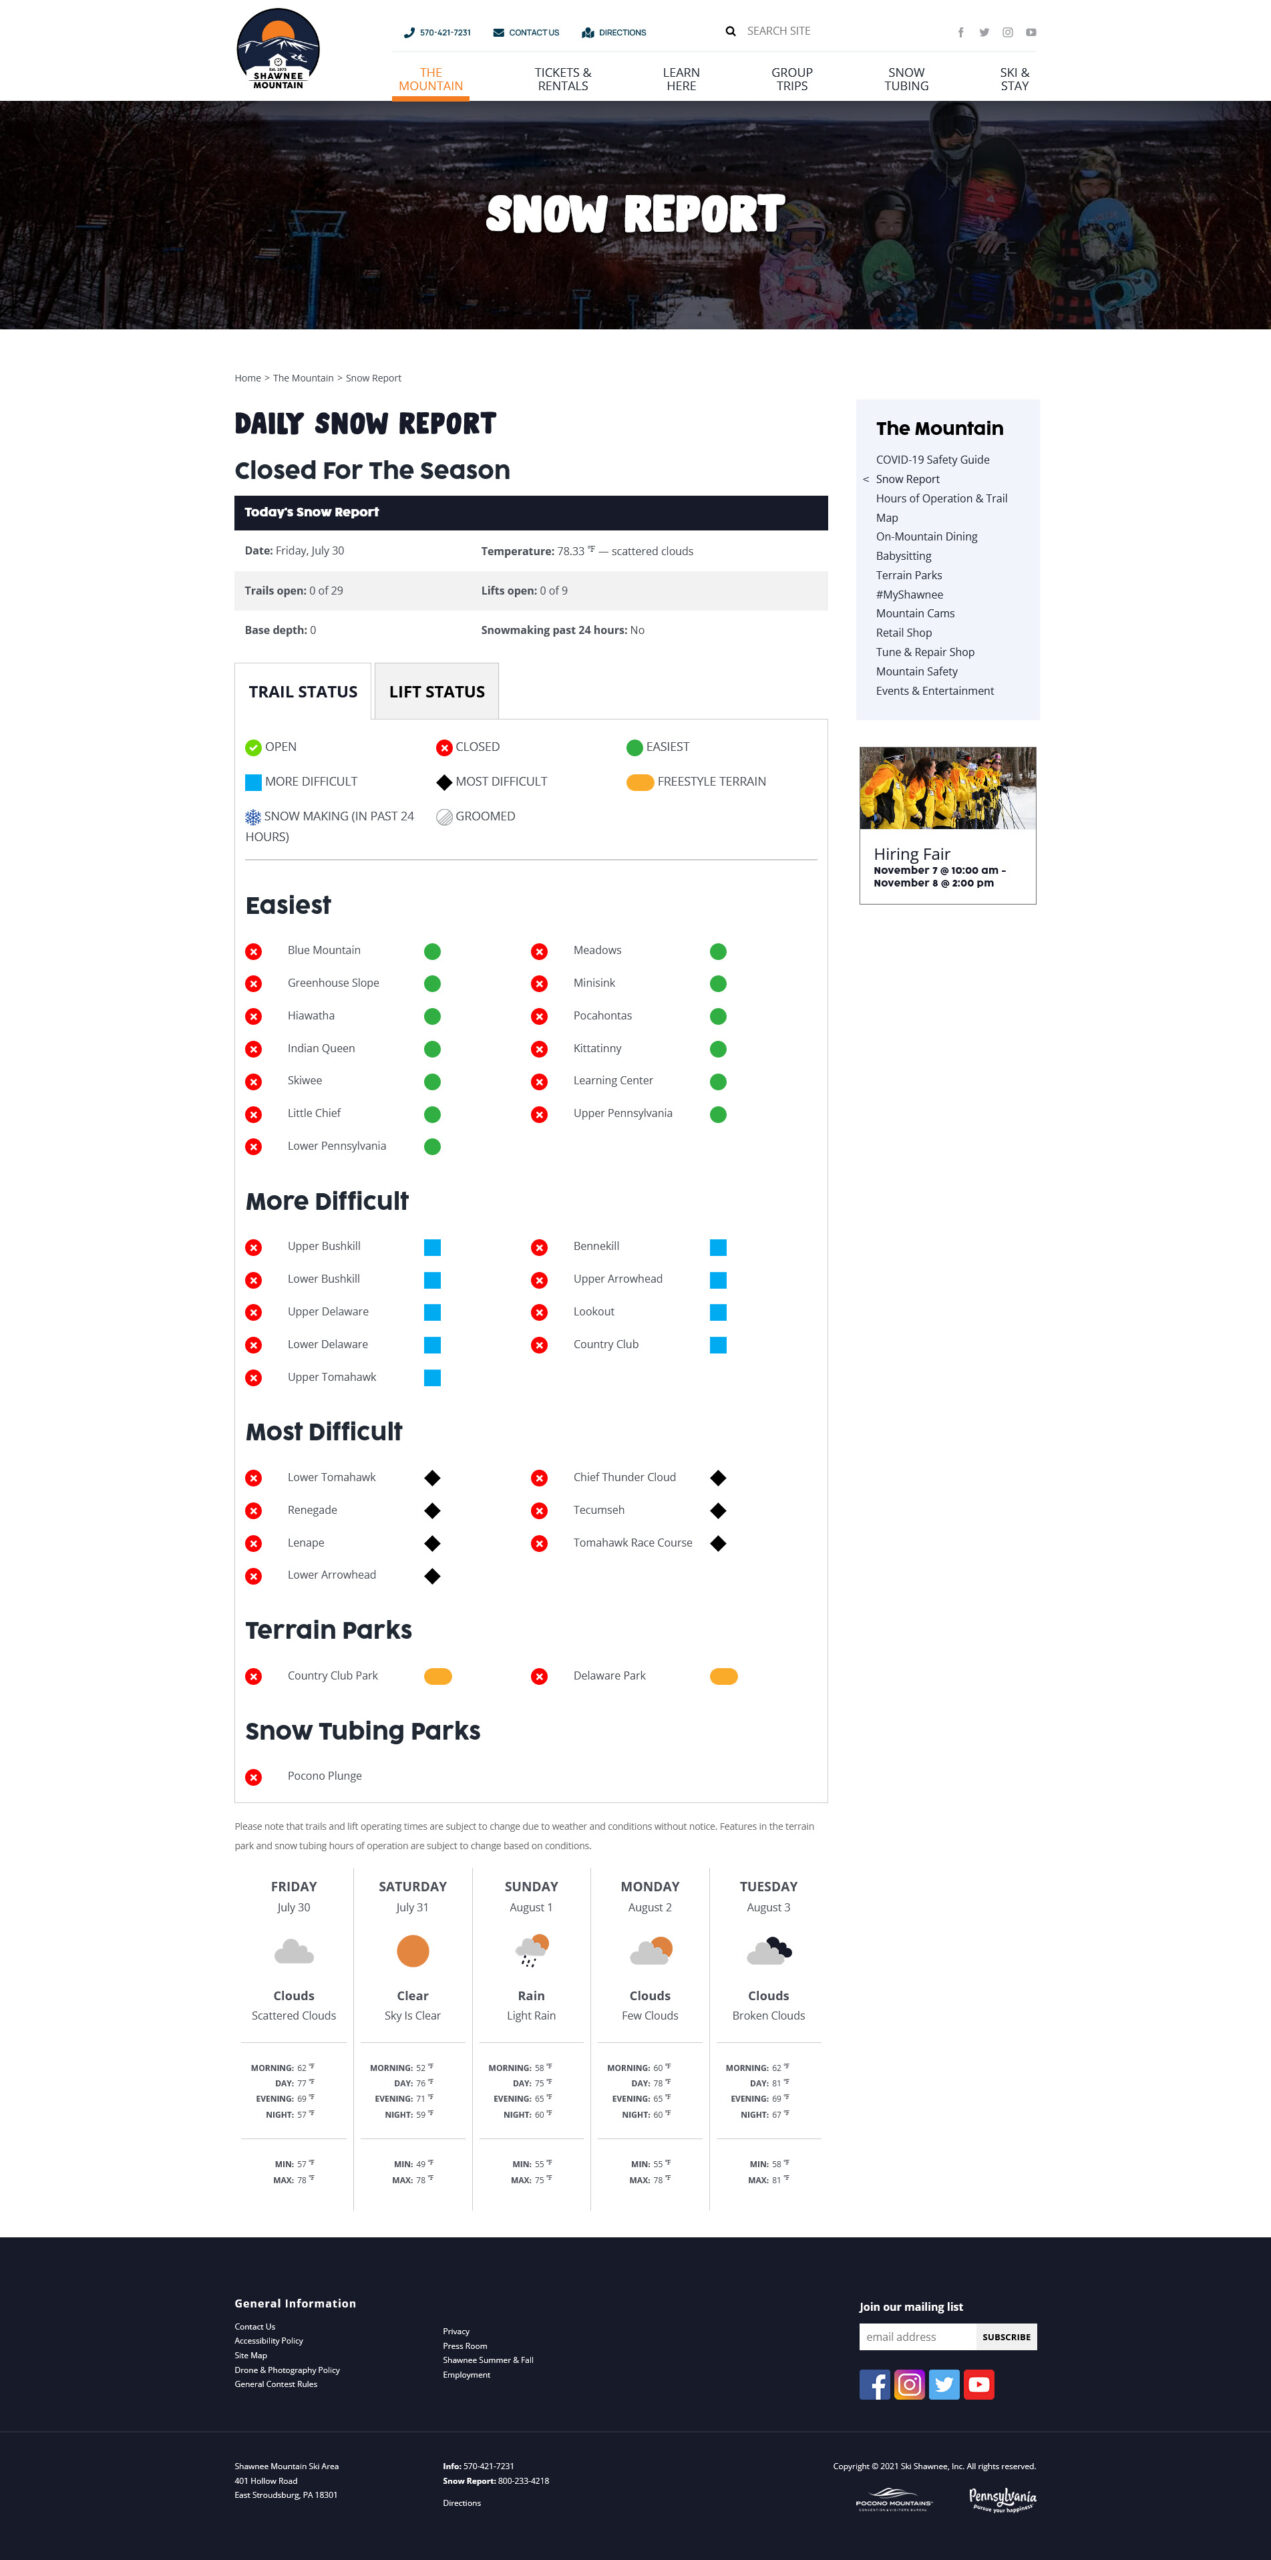
When we took over development of the https://shawneemt.com website, it was not a small task. One of the big looming problems for the project was the Weather Report functionality of their website. The original site offered a temperature readout with a weather icon of the weather at Shawnee’s facilities (within the hour) on the homepage, as well as a five day forecast on the weather report page. In addition, the back-end of the website let administrators update the report with the current status of the snow-making and various attractions.
All of this was custom work that the original developers at PeneTeleData had put together for them during the original development of their website. Not only did we want to port that over to the WordPress framework for them, but we wanted to make it faster, better branded, and more functional.
Click on the image to get a full sized image.
The Solutions

Our developers flexing their CSS muscles.
First, we wanted the information to be as recent as possible, and with our aggressive page caching that means we needed to rely on Ajax content loading. Luckily WordPress gives us the very tool we need to accomplish that. Behind every WordPress site (unless it’s been disabled by the operator) is a full JSON REST API, and the API provides so much functionality that it’s been a security issue for many plugins in the past. Luckily we’re not going to be doing anything that we wouldn’t let normal users do. We’ll simply be asking the database what the most recent data is, and requesting new data from our external weather API if it’s older than an hour.
Additionally, we’ll register a recurring automated task that will run every hour even if users aren’t on the site, to ensure that we are keeping our data as up to date as possible, and minimizing the possibility of a user having to wait for the external API to respond before they can see any content.
Next, the weather API sends us icon codes that correspond to the different weather conditions, but taking their example icons and giving them to one of our graphic designers we were able to rework and recolor the icons to fit into Shawnee’s new branding.
The original module, as built in Drupal, spread all the data about the different slopes, lifts, and other attractions across a number of menus that had to be navigated to to correctly update the report each day, taking around 20 minutes according to our estimation. We’re custom writing this plugin anyway, so we’ll simply consolidate all this to a single menu. It will be large, but as each attraction has to be addressed each day, it will mean that whoever is updating the report will be able to go through and update everything at once without waiting on additional page loads or navigation.
Finally, we make the whole thing much more useful for end-users by outputting the weather and temperature on every page, not just the homepage, adding additional markup to the smaller “tab” styled report to give weather information to screen readers and any other users who make heavy use of the title tool-tips, as well as making the opening and closing of the report more uniform and consistent.
The Result
On a very surface level, the end result is the same. It’s the same kind of data displayed in a very similar fashion. But by revising how that data is placed on the page, re-examining how the user interacts with it, and adjusting how the data is acquired we made the report faster, more useful, and more professional.
But functionally, it’s a better implementation that offers the same information but lowers the business costs associated with giving it to users.

It’s also faster, which makes a big difference.
LVL UP has a staff full of experts if you want a custom implementation, or just want to improve something you already have on hand.